The Memory Usage window displays a graphical summary of how memory has been used in each memory segment of a linked application.
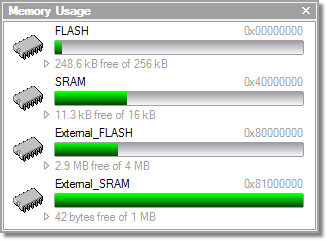
Each bar represents an entire memory segment. Green represents the area of the segment that contains code or data.
To activate the Memory Usage window:
- Choose View > Memory Usage or press Ctrl+Alt+Z.
The memory-usage graph will only be visible if your active project's target is an executable file and the file exists. If the executable file has not been linked by SEGGER Embedded Studio, memory-usage information may not be available.
Displaying section information
The Memory Usage window can also be used to visualize how program sections have been placed in memory. To display the program sections, simply click the memory segment to expand it; or, alternatively, right-click and choose Show Memory Sections from the shortcut menu.
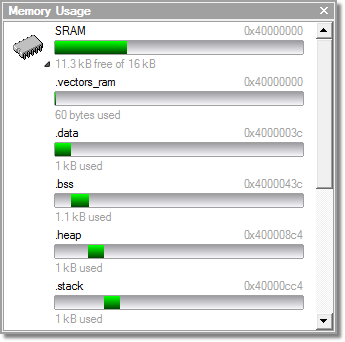
Each bar represents an entire memory segment. Green represents the area of the segment that contains the program section.
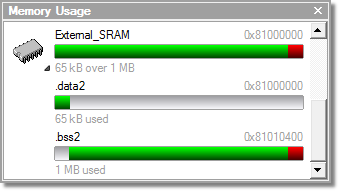
Displaying segment overflow
The Memory Usage window also displays segment overflows when the total size of the program sections placed in a segment is larger than the segment size. When this happens, the segment and section bars represents the total memory used, green areas represent the code or data within the segment, and red areas represent code or data placed outside the segment.
Getting more-detailed information
If you require more-detailed information than that provided by the Memory Usage window, such as the location of specific objects within memory, use the Symbol browser window.